Research
Our research concerns the use of remote sensing and computer modeling to observe, monitor and simulate forest ecosystems as they are influenced by humans and their environment.
Forests are structurally complex, dynamic organisms which interact with their environment (air temperature, CO2, wind, solar radiation, humidity) to assimilate carbon and grow. Forests contribute to human well-being by reviving a sense of connection with the natural world, and they are under increasing pressure globally as land is converted to other uses.
Our research program focuses on three sets of studies:
Canopy structure, light and function
This set of studies investigates links between canopy structure, reflectance and function, in terms of light interception, photosynthesis and evaporation. It integrates the development of physically based phytometrical methods using ground-based lidar data to describe the 3D geometry of forest canopies, with physically based models to enable the study of links between canopy structure, light reflectance and interception, and canopy-level gas exchanges.
The research is highly interdisciplinary and involves integrating lidar remote sensing, field work, algorithm development for data processing, and biophysical modeling. The main objective is to improve leaf-to-canopy scaling schemes within terrestrial biosphere models (TBMs).
Selected publications
- Mapping wood area in forests from ground lidar and estimating their light interception using radiative transfer modeling. Béland (2025). Agricultural and Forest Meteorology.
- Drivers of deciduous forest near-infrared reflectance: A 3D radiative transfer modeling exercise based on ground lidar. Béland & Kobayashi (2024). Remote Sensing of Environment.
- Mapping forest leaf area density from multiview terrestrial lidar. Béland & Kobayashi (2021). Methods in Ecology and Evolution.
Forest microclimate and canopy fluxes
This axis develops multilayer canopy models that simulate how forests exchange CO2, heat and water with the atmosphere, layer by layer from the forest floor to the top of the canopy. Our CanVeg2 model combines radiative transfer, heat storage and turbulent transport. Evaluated over long time series at five broadleaf forest sites with contrasting canopy structures, its CO2 and latent heat fluxes closely match eddy covariance measurements.
The model also estimates canopy properties that are nearly impossible to measure directly, such as the temperature of leaves and stems at each height in the canopy. Woody stems absorb a large share of near-infrared radiation in dense forests, store it as heat during the day and release it at night. We added this absorption to CanVeg2 in a way that is efficient enough for routine microclimate simulations, and tested it against a 3D ray-tracing model built from ground lidar and against tower measurements of albedo in four broadleaf forests.
Selected publications
- Advances in modelling radiative transfer, heat storage and turbulent transport to evaluate CO2, heat and water fluxes over broad-leaved forests: The CanVeg2 model. Béland, Bonan, Meyers, Munger, Kobayashi & Baldocchi (2026). Global Change Biology.
- Consideration of radiation absorption by stems in forests for microclimate modeling. Béland, Bonan, Kobayashi & Baldocchi (2026). Geoscientific Model Development.
Monitoring forest disturbances from space
This axis uses satellite time series to map how forests change. It began with near-real-time deforestation detection in Malaysia and Indonesia, combining Google Earth Engine and 30 m imagery from three sensors. This work was done in partnership with private firms, to help industries reach their impact-reduction goals with continuous information on land use change.
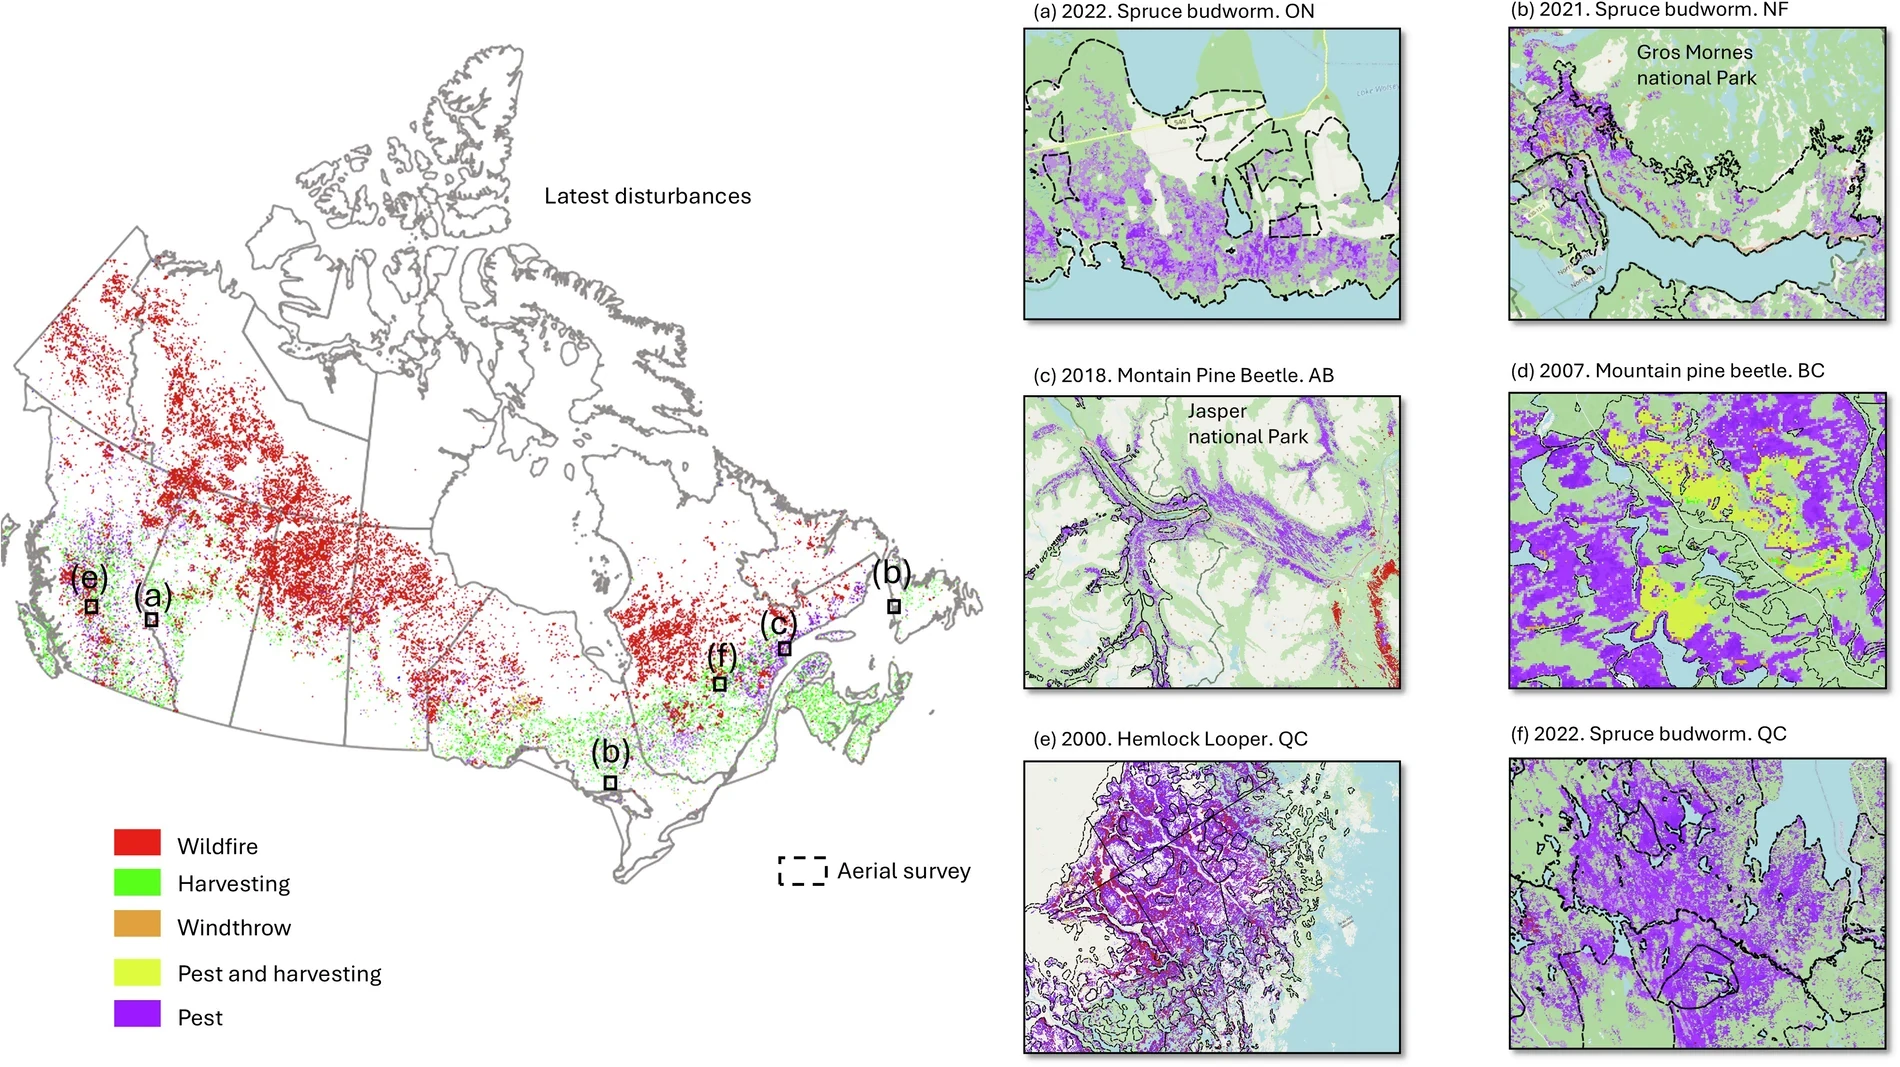
Recent work by our students has focused on Canada’s boreal forest. Pauline Perbet used deep learning on Landsat time series to detect and classify disturbances, including partial and progressive ones, produced maps of insect disturbances across Canadian forests since 1985, and tracked biomass recovery after different types of disturbance. Omid Reisi Gahrouei mapped windthrow with Sentinel-2 imagery and classified tree species at large scale by combining PRISMA hyperspectral and lidar data. Xichun Zhou mapped the extent and severity of tree mortality and defoliation caused by the spruce budworm.
Selected publications
- Mapping the extent and severity of tree mortality and defoliation caused by spruce budworm using Landsat time series. Zhou et al. (2026). International Journal of Remote Sensing.
- Windthrow mapping in boreal forests using a spatio-temporal deep learning approach and Sentinel-2 imagery. Reisi Gahrouei et al. (2026). Remote Sensing of Environment.
- Large-scale tree species classification in Canadian boreal forest using PRISMA hyperspectral and LiDAR data. Reisi Gahrouei et al. (2026). Forestry.
- Historical insect disturbance maps from 1985 onwards for Canadian forests derived using earth observation data. Perbet et al. (2025). Scientific Data.
- Evaluating Landsat time series of above-ground biomass to monitor boreal forest recovery following different types of disturbance. Perbet, Guindon, Côté & Béland (2025). Canadian Journal of Remote Sensing.
- Evaluating deep learning methods applied to Landsat time series subsequences to detect and classify boreal forest disturbances events: The challenge of partial and progressive disturbances. Perbet, Guindon, Côté & Béland (2024). Remote Sensing of Environment.
- Near real-time deforestation detection in Malaysia and Indonesia using change vector analysis with three sensors. Perbet, Fortin, Ville & Béland (2019). International Journal of Remote Sensing.
See all our work on the publications page, or find out how to join the lab.